

An organic landing page is worth more than its traffic. A page attracting 10,000 organic visits generates less commercial value than a page attracting 800 visits if the smaller page reaches users with stronger purchase intent, produces better qualified leads, or attracts customers with higher transaction values.
That makes traffic an incomplete measure of SEO performance. The more useful question is:
How much revenue can reasonably be associated with each organic landing page?
Answering that question requires connecting the page to conversions, lead quality, sales outcomes, customer value, and acquisition cost. This RankSure analysis develops a practical revenue attribution worksheet for measuring those relationships without treating every organic visit or conversion as equally valuable.
Organic Traffic Is Not the Same as Page Revenue
An organic landing page may serve a very different role depending on the business and the customer’s stage in the buying journey. Traffic measures attention. Revenue measures commercial outcome. A service page may attract someone already looking for a provider. A comparison page may help a buyer evaluate options. An educational article may introduce the business long before the customer is ready to purchase.
A local landing page may generate a small number of highly valuable calls. A product category page may lead directly to ecommerce transactions. Counting visits alone treats these pages as though they create the same economic value. A useful revenue model therefore follows the path from organic entry to business outcome. For a lead generation business:
Organic sessions × Lead conversion rate × Qualified lead rate × Sales close rate × Average sale value = Estimated revenue associated with the page
For ecommerce:
Organic sessions × Purchase conversion rate × Average order value = Direct ecommerce revenue
These formulas are starting points. The appropriate model depends on how the business earns revenue and how accurately each input can be measured.
The Revenue Formula Changes With the Business Model
There is no single formula that values every organic landing page. A page for an ecommerce retailer should not be evaluated the same way as a page for a law firm, software platform, heating contractor, or subscription service.
Lead Generation Businesses
A lead generation page creates revenue through several stages:
Organic sessions → Leads → Qualified leads → Customers → Revenue
A practical model is:
Organic sessions × Lead rate × Qualified lead rate × Close rate × Average customer value
This model suits professional services, contractors, agencies, financial services, and other businesses where the website primarily generates enquiries.
Ecommerce Businesses
An ecommerce landing page can be connected more directly to purchase data. A simplified model is:
Organic sessions × Purchase conversion rate × Average order value
For example, 5,000 organic sessions at a 2 percent purchase rate produce 100 purchases. At an average order value of $120:
100 × $120 = $12,000 in revenue
This figure still requires interpretation. Refunds, discounts, repeat purchases, product margins, and the selected attribution model can change the commercial meaning of the result.
SaaS Businesses
A software landing page may generate trial registrations, demo requests, account creations, or direct subscriptions. Its economic path can look like:
Organic sessions → Trials or demos → Qualified opportunities → Customers → Subscription value
The first subscription payment may understate the customer’s eventual economic value. Lifetime value can provide a broader estimate, but only where retention and customer value are supported by reliable historical data.
Local Service Businesses
A local service page generates relatively modest traffic while producing commercially valuable calls and form submissions. Its path might be:
Organic sessions → Calls or forms → Qualified enquiries → Booked jobs → Revenue
This makes raw traffic particularly misleading for local SEO. A page attracting 500 relevant visits can be more valuable than an informational article attracting 10,000 visitors with little purchase intent.
The RankSure Organic Landing Page Revenue Attribution Worksheet
The worksheet below moves from traffic to commercial value. Not every business needs every field. The correct inputs depend on the conversion path.
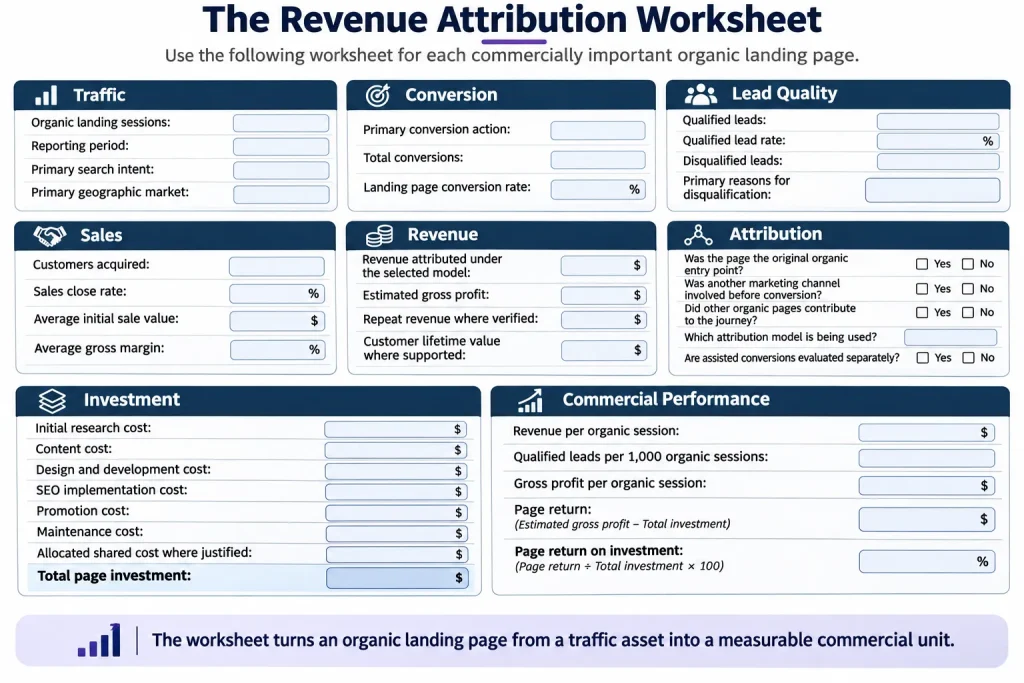
Input 1: Organic Sessions
Record the number of sessions that begin on the landing page through organic search. Google Analytics provides a Landing page report showing the first page of a session. Traffic source dimensions can then help distinguish organic search from other acquisition channels.
Do not substitute total page views for landing sessions. A page can receive views later in a session without being the page through which the organic visit began.
Input 2: Primary Conversions
Record actions that represent meaningful commercial intent. Examples include:
- Form submissions
- Phone calls
- Appointment requests
- Demo requests
- Trial registrations
- Purchases
- Quote requests
- Account registrations
Not every tracked interaction should be treated as a revenue-generating conversion. The action should represent a meaningful step toward a commercial outcome.
Input 3: Landing Page Conversion Rate
Calculate:
Primary conversions ÷ Organic sessions × 100
Suppose a page receives 2,500 organic sessions and generates 150 enquiries.
150 ÷ 2,500 × 100 = 6 percent
The page has a 6 percent enquiry conversion rate. That still does not reveal the quality of those enquiries.
Input 4: Qualified Lead Rate
A service page may attract enquiries from people outside the service area, job applicants, suppliers, spam submissions, existing customers, or users seeking services the company does not offer. Qualified lead rate separates lead volume from commercial relevance.
Calculate:
Qualified leads ÷ Total leads × 100
Suppose 150 enquiries produce 90 qualified opportunities.
90 ÷ 150 × 100 = 60 percent
The qualified lead rate is 60 percent.
Input 5: Sales Close Rate
The next question is how many qualified opportunities become customers. Calculate:
Customers ÷ Qualified leads × 100
Suppose 90 qualified leads produce 23 customers.
23 ÷ 90 × 100 = approximately 25.6 percent
The sales close rate is approximately 25.6 percent. This variable can materially change page value even when traffic and lead volume remain stable.
Input 6: Average Sale Value
Average sale value represents the revenue associated with a typical completed sale. Suppose the average customer generated by the page produces $3,000 in initial revenue. If the page generates 23 customers:
23 × $3,000 = $69,000
The estimated initial revenue associated with those customers is $69,000.
Input 7: Gross Margin
Revenue can overstate page value when fulfilment costs are substantial. Suppose the business retains a 40 percent gross margin on the $69,000 in associated revenue.
$69,000 × 40 percent = $27,600
The estimated gross profit contribution becomes $27,600 before marketing, overhead, and other operating expenses. For some investment decisions, this figure is more useful than revenue alone.
Input 8: Customer Lifetime Value
Some customers buy repeatedly. Others generate recurring subscription revenue. Customer lifetime value can therefore provide a broader view of page economics than the initial transaction. An optimistic lifetime value assumption can make a weak page appear highly valuable. Use lifetime value only where historical retention and customer behaviour support the estimate.
Input 9: Page Investment
Record the resources required to create and maintain the page. Possible costs include:
- Research
- Content production
- Design
- Development
- SEO implementation
- Digital public relations
- Technical work
- Content updates
- Conversion optimisation
- Ongoing maintenance
Shared SEO costs should be allocated cautiously because sitewide technical work, internal linking, digital PR, brand demand, and authority can benefit multiple pages at once.
Worked Example: What Is One Organic Service Page Worth?
Consider an illustrative service landing page with the following monthly performance.
- Organic sessions: 2,500
- Lead conversion rate: 6 percent
- Qualified lead rate: 60 percent
- Sales close rate: 25 percent
- Average sale value: $3,000
First, calculate total leads:
2,500 × 6 percent = 150 leads
Now calculate qualified leads:
150 × 60 percent = 90 qualified leads
Now estimate customers:
90 × 25 percent = 22.5 expected customers
For modelling purposes, the decimal represents an expected average rather than a literal half customer. Now calculate estimated revenue:
22.5 × $3,000 = $67,500
Under these assumptions, the page generates about $67,500 in monthly revenue. The final number is only as reliable as its inputs. Organic traffic classification, conversion tracking, lead qualification, close rate, and average sale value can all contain measurement error. The purpose of the model is therefore not to create false precision. It is to make the commercial chain visible.
Lead Quality Can Change Page Revenue Without Changing Traffic
Keep every variable in the previous example identical except qualified lead rate. The original scenario used a 60 percent qualified lead rate.
That produced:
- 150 leads
- 90 qualified leads
- 22.5 expected customers
- $67,500 estimated revenue
Now reduce the qualified lead rate to 30 percent. The page still receives 2,500 organic sessions. It still generates 150 leads. Traffic has not changed. Lead volume has not changed. But only 45 leads are now qualified.
At a 25 percent close rate:
45 × 25 percent = 11.25 expected customers
At $3,000 per customer:
11.25 × $3,000 = $33,750
Estimated revenue falls from $67,500 to $33,750.
That is a 50 percent reduction without any change in organic traffic or reported lead volume. This exposes a major weakness in traffic-based SEO reporting. A page can maintain its traffic and conversion rate while becoming commercially less valuable.
Why a Lower Traffic Page Can Be Worth More
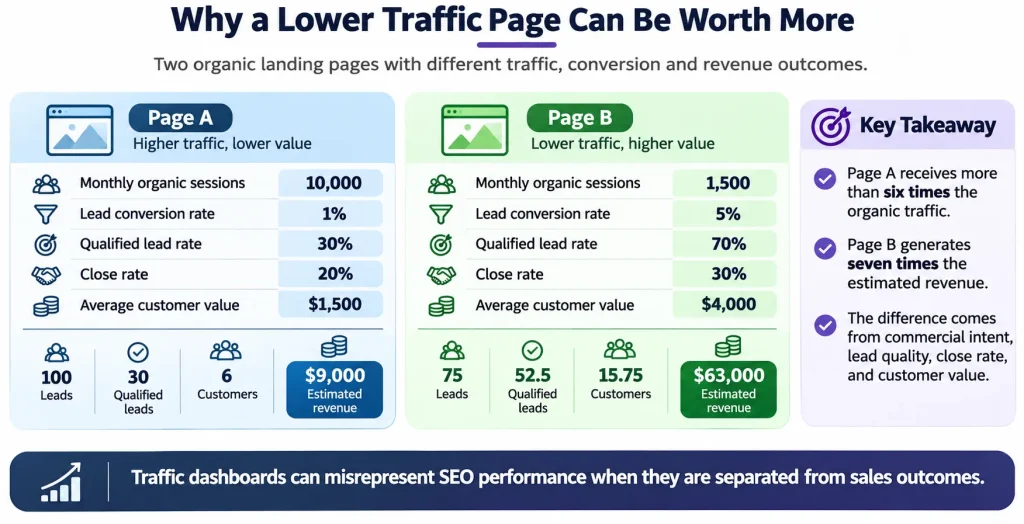
Revenue Per Organic Session Reveals Commercial Productivity
A useful page-level metric is revenue per organic session. Calculate:
Revenue attributed under the selected model ÷ Organic sessions
For Page A:
$9,000 ÷ 10,000 = $0.90 per organic session
For Page B:
$63,000 ÷ 1,500 = $42 per organic session
This metric does not replace total revenue. It answers a different question:
How commercially productive is the traffic entering through this page?
A page with high revenue per session can justify further investment even when its total traffic remains modest.
Qualified Leads Per 1,000 Organic Sessions Can Be More Useful Than Revenue
Lead generation businesses do not always have reliable page-level revenue attribution. Qualified lead efficiency can provide an intermediate measure.
Calculate:
Qualified leads ÷ Organic sessions × 1,000
Suppose a page generates 40 qualified leads from 2,000 organic sessions.
40 ÷ 2,000 × 1,000 = 20
The page generates 20 qualified leads for every 1,000 organic sessions. This metric allows businesses to compare the commercial quality of landing page traffic even before full revenue attribution is available.
Direct Revenue Is Not the Same as Total Page Influence
Not every page converts during the first organic session. A user may discover a company through an educational article, return through a branded search several days later, visit a service page, submit a form, and eventually become a customer. Giving all revenue credit to the final interaction would ignore the discovery role of the original page. Giving all credit to the first organic landing page would create the opposite problem.
Google Analytics uses attribution models to assign conversion and revenue credit across interactions that contribute to a customer journey. The selected attribution model therefore influences how much revenue appears to belong to a particular page or channel. A landing page can have:
Direct Value
Revenue associated with journeys where the page functions as a primary measurable acquisition or conversion point.
Assisted Value
Revenue influenced by the page even though another interaction receives some or all of the conversion credit. These should not be treated as identical. Attributed revenue is a measurement output based on the selected model. It should not automatically be interpreted as proof that one landing page caused the entire commercial outcome.
Why Informational Pages Are Harder to Value
Commercial landing pages have a shorter path to revenue. Informational pages contribute much earlier. Consider an article answering a technical question. The visitor may read the article, leave, return through Google several weeks later, visit a commercial page, submit a form, speak with sales, and become a customer.
The original article contributed to discovery. Assigning an exact dollar amount to that contribution may still be difficult. Informational content should therefore not be judged using the same direct revenue threshold as a high-intent service page. Useful supporting measures include:
- Assisted conversions
- Movement to commercial pages
- New users introduced to the brand
- Qualified conversions involving the page
- Revenue paths involving the content
The objective is not to manufacture page revenue. It is to recognise that customer journeys can contain several commercially useful pages.
Should Landing Page Value Use Revenue, Gross Profit, or Lifetime Value?
The correct metric depends on the decision being made.
Use Revenue for Top-Level Commercial Measurement
Revenue is useful for understanding the scale of business associated with organic search. Its limitation is that the same revenue can produce very different economic value across businesses with different cost structures.
Use Gross Profit for Investment Decisions
Gross profit can be more useful when comparing page investment with economic return. A page generating $50,000 in revenue at a 70 percent gross margin has different economics from one generating the same revenue at a 15 percent margin.
Use Lifetime Value for Recurring Relationships
Lifetime value becomes relevant where customers continue purchasing after the initial acquisition. This matters for subscription businesses, SaaS companies, memberships, and services with repeat business.
Lifetime value should be based on observed retention and customer behaviour. Do not multiply customers by an aspirational lifetime value and present the result as realised revenue.
How Much Revenue Must a Landing Page Generate to Justify Its Cost?
A landing page is an investment. Its economic return can therefore be compared with the resources required to create and maintain it. Suppose a commercially important landing page requires:
- Research: $800
- Content: $1,200
- Design and development: $1,500
- SEO implementation: $1,000
- Annual maintenance: $500
- Total first year investment: $5,000
Suppose the page generates $20,000 in attributable gross profit during the same period. A simplified page return is:
Attributable gross profit minus page investment
$20,000 minus $5,000 = $15,000
A simplified return on investment calculation is:
Net return ÷ Page investment × 100
$15,000 ÷ $5,000 × 100 = 300 percent
This is an illustrative calculation rather than a universal SEO return formula. Shared SEO costs, sales expenses, assisted conversions, overhead, and multi-page customer journeys complicate the true economics. The value of the calculation is that it moves page evaluation from traffic volume to commercial return.
What Makes an Organic Landing Page More Valuable?
Several variables can materially change page value.
Search Intent
Pages targeting users closer to a commercial decision can generate substantial revenue from modest traffic.
Conversion Rate
A stronger conversion rate increases the number of commercial opportunities created from the same traffic volume.
Lead Quality
A high conversion rate has limited value when most leads cannot become customers.
Sales Close Rate
SEO can create demand opportunities. The sales process determines how many qualified opportunities become customers. Landing page economics therefore depend partly on what happens after the website conversion.
Average Customer Value
Pages attracting customers for higher value products or services can generate greater revenue with fewer sales.
Customer Retention
A page attracting long-term customers can have stronger economics than a page attracting one-time purchasers.
Gross Margin
Revenue quality matters. A high revenue page selling low margin products can produce less economic return than a lower revenue page selling high margin services.
What Can Make Organic Page Revenue Look Better Than It Really Is?
Revenue attribution becomes misleading when strong-looking outputs are built on weak assumptions.
| Attribution mistake | Why it overstates page value | Better approach |
| Counting every lead equally | Unqualified enquiries inflate commercial value. | Measure qualified leads, not just submissions. |
| Assigning all revenue to one page | Other pages and channels may influence the sale. | Consider multi-touch journeys and attribution limitations. |
| Unsupported lifetime value | Optimistic retention assumptions inflate revenue estimates. | Use historical retention and customer revenue data. |
| Ignoring refunds and cancellations | Recorded sales may exceed realised revenue. | Adjust for refunds, cancellations and failed payments. |
| Ignoring gross margin | High revenue does not necessarily mean high profitability. | Compare gross profit alongside revenue. |
| Ignoring existing brand demand | SEO may receive credit for demand created elsewhere. | Separate branded and non-branded organic performance where possible. |
| Ignoring page investment | Revenue alone hides production and maintenance costs. | Include attributable page costs in profitability analysis. |
How to Measure Organic Landing Page Revenue in Practice
Start with the landing page rather than the site total. Google Analytics provides a Landing page report showing the first page a visitor encounters during a session. Traffic source information can be used to isolate organic search sessions. For ecommerce businesses, properly configured transaction and revenue data can connect organic acquisition with purchases. Lead generation businesses need additional systems. A practical measurement stack includes:
- Google Analytics for landing sessions, key events, and acquisition paths
- Google Search Console for clicks, impressions, queries, and organic visibility
- A customer relationship management system for lead quality, opportunity status, close rate, and customer value
- Call tracking where phone enquiries are important
- E-commerce systems for purchases, order values, refunds, and repeat transactions
- Finance data for realised revenue and margin
No single platform necessarily contains the complete commercial truth. The strongest analysis connects search, analytics, CRM, sales, and financial data.
The Revenue Attribution Worksheet
Use the following worksheet to evaluate the commercial performance of each important organic landing page. Record traffic, conversions, lead quality, sales outcomes, attributed revenue, and investment costs for the same reporting period.
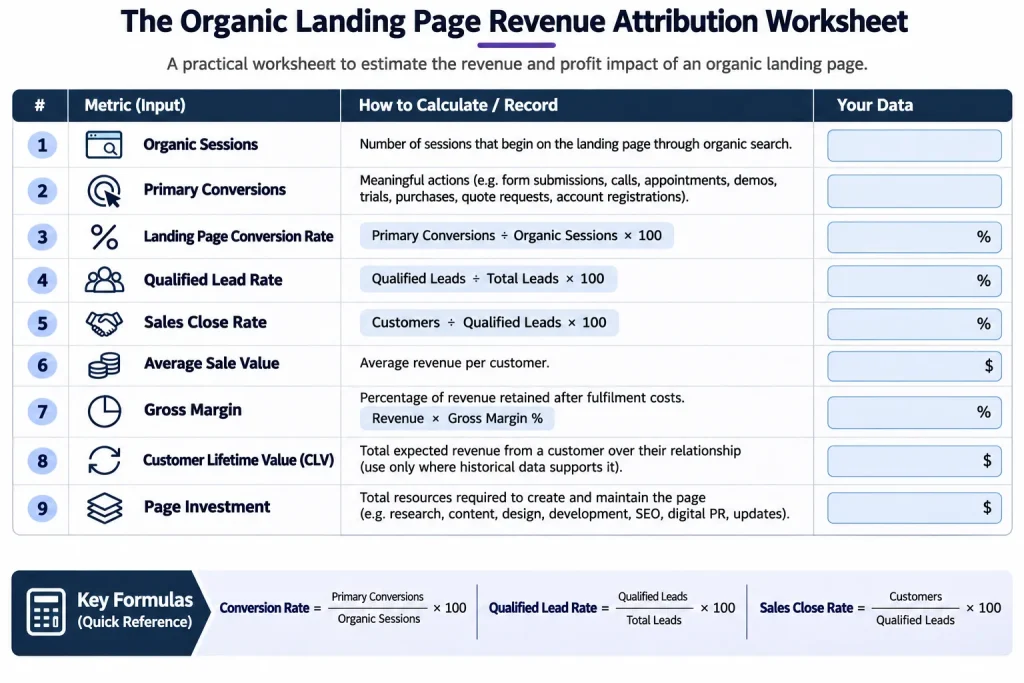
The worksheet connects organic search performance with measurable business outcomes. It helps identify whether a landing page generates qualified opportunities, contributes to revenue, and delivers sufficient returns to justify its investment.
What Should Businesses Measure Instead of Traffic Alone?
Traffic remains useful because it shows the size of the audience reaching the page. It becomes meaningful when combined with metrics that reveal commercial quality.
For lead generation businesses, useful page-level measures include:
- Organic sessions
- Lead conversion rate
- Qualified lead rate
- Qualified leads per 1,000 sessions
- Sales close rate
- Revenue per organic session
- Gross profit per organic session
For ecommerce businesses, useful measures include:
- Organic sessions
- Purchase conversion rate
- Revenue
- Average order value
- Revenue per organic session
- Gross profit
- Repeat purchase value
The appropriate KPI depends on the economic role of the page.
Conclusion
Organic landing page value cannot be measured by traffic alone. Commercial value depends on search intent, conversion quality, sales performance, customer value, and the attribution model used.
The most useful measurement connects:
Organic traffic → Conversion → Qualification → Customer → Revenue → Profit
Some pages generate direct revenue, while others assist later conversions. The goal is not to assign every dollar to one page, but to identify which pages create the strongest economic return from the search demand they capture.
Measure SEO Against Business Outcomes
RankSure helps Canadian businesses connect organic search performance with commercially meaningful outcomes rather than relying on rankings and traffic alone. Page-level revenue analysis can help identify which organic assets deserve further investment, which attract valuable customers, and where traffic growth is failing to translate into business growth.
Research Sources
Google Analytics Help
Landing Page Report
Get Started With Attribution
How to Attribute Credit for Key Events
About Ecommerce Metrics
Research Transparency
This RankSure analysis combines official Google Analytics documentation with original mathematical examples and a practical revenue attribution worksheet. All numerical examples are illustrative. They do not represent actual RankSure client revenue, conversion rates, margins, or campaign results. The worksheet is a practical measurement model rather than a statistically validated attribution methodology. Actual landing page revenue depends on the business model, measurement configuration, attribution model, sales process, customer value, and available financial data.