
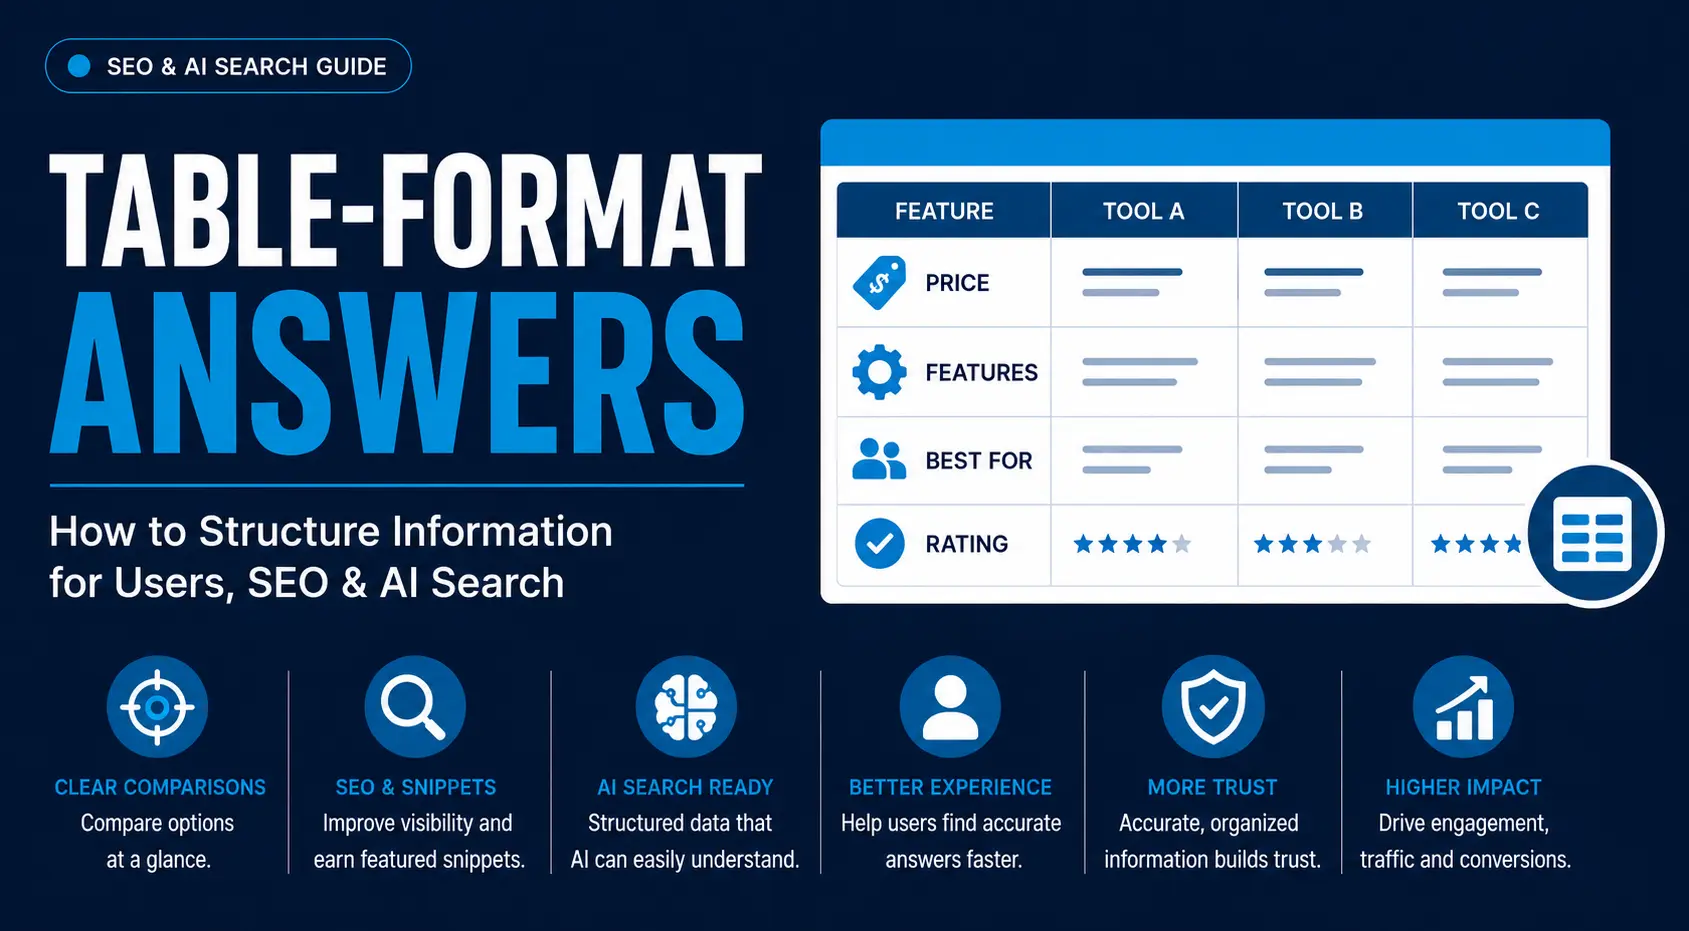
Table-format answers organize entities, attributes, and values into labeled rows and columns. This structure lets users compare information and helps search systems identify relationships.
Search engines increasingly extract direct answers from structured content. Comparison queries, pricing searches, specifications, definitions, and research questions often produce table-based results because tables establish clear relationships between entities, attributes, and values.
A well-designed table can support:
- Google Featured Snippets and table snippets
- AI-generated answers and retrieval systems
- Answer Engine Optimization (AEO)
- Generative Engine Optimization (GEO)
- Faster user decision-making
- Better content comprehension
The value of a table is not visual decoration. It is information architecture. A good table tells search engines: this entity has these attributes, and these values describe those attributes.
Structured tables reduce ambiguity in Retrieval-Augmented Generation systems by separating each entity, attribute, and value.
| Entity | Attribute | Value |
| Tool A | Pricing | $99/month |
| Tool A | Users | 10 seats |
What Are Table-Format Answers?
Definition and Structure of Table-Format Answers
A table-format answer is a structured response where information is organized into horizontal rows and vertical columns. Each column represents a specific attribute, while each row usually represents an entity, category, process step, or data point.
The core components include:
| Component | Purpose |
| Header row | Defines the meaning of each column |
| Columns | Represent attributes or categories |
| Rows | Represent entities, examples, or records |
| Cells | Contain individual data points |
| Caption | Provides context about the table |
Example:
| SEO Tool | Best For | Starting Price |
| Ahrefs | Backlink analysis | Paid plans |
| Semrush | Keyword research | Paid plans |
| Google Search Console | Search performance monitoring | Free |
The table connects each SEO tool with its primary use and pricing model.
A paragraph might explain these differences across several sentences. A table compresses the same information into a predictable schema.
Table Answers vs Paragraph-Based Answers
Paragraphs work well when the user needs reasoning, context, or explanation. Tables work better when the user needs comparison, classification, or reference information.
| Format | Best Used For | Example |
| Paragraph | Explaining concepts and relationships | How semantic SEO works |
| List | Presenting grouped items or sequences | SEO checklist |
| Table | Comparing attributes and values | SEO tool comparison |
A table is not automatically better than prose. It solves a specific information problem: multiple related data points that need quick comparison.
Why Table-Format Answers Matter for Search and Information Retrieval
Improving User Understanding and Decision-Making
Users scan comparison content for prices, features, limitations, and use cases. Tables place these decision factors in one view. The reader does not need to remember details from different paragraphs and mentally compare them.
Common benefits include:
- Faster scanning of important information
- Easier comparison between options
- Improved content accessibility
- Better decision-making for evaluation queries
- Higher information density without longer copy
An ‘Ahrefs vs Semrush pricing’ search requires 4 decision factors:
- Price
- Features
- Limitations
- Best use case
The same principle applies to technical documentation, product pages, research papers, and educational resources.
Helping Search Engines Extract Structured Information
Search engines analyze content relationships, not only keywords.
A table creates a predictable information model:
Entity → Attribute → Value
Example:
| Entity | Attribute | Value |
| Core Web Vitals | Metric | INP |
| Core Web Vitals | Purpose | Interaction responsiveness |
This structure helps search systems connect:
- Entities
- Attributes
- Relationships
- Numerical values
- Categories
Google extracts table relationships more clearly when descriptive headers connect entities with specific attributes and values. Queries such as:
- “SEO tools comparison”
- “HTML table tags”
- “Medicare vs Medicaid differences”
- “ANOVA table example”
naturally align with tabular answers.
Tables also improve eligibility for table-based Featured Snippets because search engines can identify clear rows and columns.
Table formatting alone does not improve rankings. Search-focused headers, accurate values, and relevant comparisons determine the table’s usefulness.
Supporting AI Search and Question Answering Systems
AI search engines and large language models process information differently from traditional search engines. They need clear relationships between concepts.
Tables provide a compact semantic structure.
A model can interpret:
| Entity | Attribute | Value |
| Shopify | Platform Type | Ecommerce CMS |
| Shopify | Pricing Model | Subscription |
without reconstructing meaning from multiple paragraphs.
This matters for:
- Retrieval-Augmented Generation (RAG)
- AI-generated summaries
- Knowledge retrieval
- Conversational search responses
A paragraph saying:
“Shopify is an ecommerce platform with subscription pricing and multiple plans…”
contains useful information, but the relationships are less explicit.
Entity-Attribute Mapping in AI Search
Strong table structures often mirror knowledge graph relationships.
Example:
| Entity | Attribute | Value |
| WordPress | Type | CMS |
| WordPress | Language | PHP |
| WordPress | Hosting Model | Self-hosted |
The entity remains consistent while attributes change.
Types of Table-Format Answers
Comparison Tables
Comparison tables evaluate differences among 5 types of options
- Products
- Services
- Software tools
- Alternatives
- Pricing plans
The comparison attributes include:
| Attribute | Product A | Product B |
| Pricing | Monthly subscription | Annual license |
| Main Feature | Keyword research | Backlink analysis |
| Best For | SEO teams | Content teams |
Comparison tables perform well for commercial investigation queries because users are evaluating choices.
Examples:
- “Semrush vs Ahrefs”
- “iPhone vs Android”
- “CRM software comparison”
The key requirement is selecting attributes users actually care about. A table filled with irrelevant columns creates noise.
Reference and Definition Tables
Reference tables support quick lookup by placing terms, categories, or concepts beside their exact definitions.
Common uses:
- Glossaries
- Terminology explanations
- Category definitions
- Industry references
Example:
| Term | Definition |
| Crawlability | A search engine’s ability to access website pages |
| Indexability | Whether pages can be stored in a search index |
Specification and Feature Tables
Specification tables present technical details and measurable attributes.
Common applications:
- Software comparisons
- Product specifications
- Hardware details
- API documentation
Example:
| Specification | Value |
| Database Type | Relational |
| Programming Language | Python |
| API Support | REST |
Technical audiences prefer this format because important details can be located immediately.
Process and Workflow Tables
Process tables convert operational guidance into ordered stages, actions, and expected outputs.
Example:
| Stage | Action |
| Research | Identify search intent |
| Planning | Map keywords to pages |
| Optimization | Improve content structure |
Data and Research Tables
Research tables present measured results, statistical findings, or datasets.
Common examples include:
- ANOVA tables
- Correlation tables
- Regression results
- T-test results
- Market research data
Example:
| Variable | Correlation Value | Significance |
| Traffic | 0.82 | Significant |
| Rankings | 0.76 | Significant |
Academic and analytical content depends heavily on consistent table formatting because relationships between values matter more than narrative description.
When Should You Use a Table-Format Answer?
Queries That Require Comparison or Multiple Attributes
Tables are the strongest format when users need to compare multiple options.
Use tables for:
- “X vs Y” searches
- Feature comparisons
- Pricing comparisons
- Product evaluations
- Service comparisons
A query like “best SEO tools” can become difficult to process when every tool is described separately. A table creates a decision framework.
Queries That Need Quick Reference Information
Tables work well for:
- Definitions
- Categories
- Rankings
- Specifications
- Feature lists
Users searching for reference information usually want retrieval speed.
Examples:
- HTML tags list
- Schema types
- SEO metrics
- Marketing funnel stages
When Tables Are Not the Best Format
Tables should not replace explanations.
Avoid using tables for:
- Complex concepts requiring context
- Detailed tutorials
- Narrative storytelling
- Step-by-step guides requiring reasoning
A table can show the steps of a process, but it cannot always explain why those steps matter.
Poor table usage usually happens when writers force every topic into rows and columns. Not every relationship is naturally tabular.
How to Create Effective Table-Format Answers
Identify the Search Intent and Information Structure
Create a table in 4 steps:
- identify the query,
- list the entities,
- select decision-relevant attributes, and
- remove unrelated fields.
Example:
Query: “Best email marketing platforms”
Entities:
- Mailchimp
- ConvertKit
- HubSpot
Attributes:
- Pricing
- Automation
- Target users
- Integrations
Unnecessary attributes should be removed. More columns do not automatically mean more value.
Choose the Right Table Structure
The table format should match the information goal.
| Goal | Recommended Table Type |
| Compare entities | Comparison table |
| Explain concepts | Reference table |
| Show workflow | Process table |
| Present measurements | Data table |
| Display specifications | Feature table |
The selected structure controls whether users compare entities, review specifications, follow a process, or examine measurements.
Design Clear Headers and Organized Data
Column headers act as semantic labels. Weak headers create ambiguity.
Poor:
| Feature | Details |
| Speed | Fast |
Better:
| Tool | Page Speed Feature |
| Tool A | Performance monitoring |
Best practices:
- Use descriptive column names
- Keep one attribute per column
- Maintain consistent terminology
- Put important information first
- Avoid excessive columns
- Keep cells concise
Provide Context Around the Table
A table needs supporting content.
Introduce the comparison, define the criteria, and state its purpose before the table. Interpret the main differences and provide a recommendation after the table.
Search engines can extract tables, but users still need context to understand why the data matters.
Optimizing Table-Format Answers for SEO and AI Search
Create Search-Friendly Table Structures
A table becomes more valuable when its structure matches how users search.
Search engines and AI systems do not only look for keywords inside cells. They analyze relationships between labels, entities, and values.
A search-friendly table uses 5 elements:
- Query-aligned headers
- Clear entity names
- Concise cell content
- Consistent terminology
- Direct answers near the table
Example:
Search query: “SEO audit tools comparison”
Weak table:
| Tool | Information |
| Ahrefs | Good tool |
| Semrush | Many features |
Optimized table:
| SEO Tool | Primary Use Case | Key Feature |
| Ahrefs | Backlink analysis | Link database |
| Semrush | Keyword research | Competitive analysis |
Align Headers With Search Queries
Headers often become extraction points for search systems.
A query such as:
“Which SEO tools offer free plans?”
matches better with:
| SEO Tool | Free Plan Availability |
than:
| Tool | Details |
Generic labels force search engines to infer meaning. Explicit labels remove that ambiguity.
Improve Semantic Understanding With Entity Relationships
Modern search systems increasingly understand content through entities and relationships.
A well-structured table follows an entity-attribute-value model:
| Entity | Attribute | Value |
| Google Search Console | Cost | Free |
| Google Search Console | Main Function | Search performance monitoring |
The entity, attribute, value model contains 3 components:
- Entity: The subject being described
- Attribute: The characteristic being measured
- Value: The specific information
This structure supports:
- Entity recognition
- Knowledge graph connections
- AI retrieval accuracy
- More precise answer generation
“Tool A → Feature → Keyword clustering” identifies the entity, attribute, and value directly, while “Tool A has advanced features” leaves the feature unidentified.
Maintain Accuracy and Data Freshness
Tables often contain information that changes frequently.
Examples:
- Pricing
- Software features
- Product specifications
- Regulations
- Market statistics
Outdated tables damage user trust and can reduce search performance.
Maintain table accuracy by:
- Reviewing changing data regularly
- Adding update dates when relevant
- Citing reliable sources
- Removing obsolete values
- Checking competitor comparisons periodically
Review pricing tables every 3–6 months and display the last verified date beside changing values.
Technical Implementation of SEO-Friendly Tables
Use Semantic HTML Table Structure
HTML tables provide meaning through their native elements.
A properly structured table uses:
<table>
<caption>SEO Tool Comparison</caption>
<thead>
<tr>
<th>Tool</th>
<th>Main Feature</th>
<th>Pricing</th>
</tr>
</thead>
<tbody>
<tr>
<td>Ahrefs</td>
<td>Backlink Analysis</td>
<td>Paid Plans</td>
</tr>
</tbody>
</table>
Important HTML elements:
| Element | Purpose |
| <table> | Defines the table structure |
| <caption> | Provides table context |
| <thead> | Contains header information |
| <th> | Defines column or row headings |
| <tbody> | Contains data rows |
| <td> | Defines individual data cells |
Semantic HTML defines 4 machine-readable relationships:
- table context,
- header labels,
- data rows, and
- individual values.
Native table elements expose these relationships more clearly than unrelated <div> elements styled as a grid.
Make Tables Accessible
Logical relationships between headers and cells help screen readers, users, and search crawlers interpret table data.
Follow accessibility practices:
- Use descriptive headers
- Avoid empty header cells
- Maintain logical reading order
- Associate headers correctly
- Add captions when needed
Complex tables require scope=\”col\” for column headers and scope=\”row\” for row headers.
Accessible tables create a clearer content structure for all users and systems.
Avoid Technical Issues That Prevent Table Understanding
Some tables look correct visually but fail during extraction.
Common problems include:
Image-Based Tables
Text inside screenshots or images cannot be reliably interpreted as structured data.
A comparison table saved as a PNG may look attractive but loses:
- Crawlable text
- Semantic relationships
- Accessibility support
Use real HTML tables whenever possible.
Hidden Table Content
Content hidden through CSS, collapsed sections, or conditional rendering may not be consistently extracted.
Examples:
- display:none
- JavaScript-generated tables after page load
- Content loaded only after user interaction
Search engines have improved rendering capabilities, but essential answer content should remain available in the initial HTML whenever possible.
Poor HTML Structure
Common technical mistakes:
- Missing header rows
- Mixing unrelated data types
- Using tables only for visual layout
- Incorrect nesting
- Excessive merged cells
Tables should represent data relationships, not page design.
Schema Markup and Structured Data Relationship
HTML tables and schema markup serve different purposes.
HTML tables communicate visible content structure.
Schema markup communicates machine-readable information.
Example:
A product comparison table shows:
| Product | Price | Rating |
| Product A | $50 | 4.8 |
Structured data may provide additional machine signals about:
- Products
- Reviews
- Organizations
- Datasets
Schema does not replace a well-built table.
A page with perfect JSON-LD but unclear visible content still creates a weak user experience.
For data-heavy pages, Dataset schema or relevant structured data types may support machine understanding, but the table itself remains the primary information source.
Designing Mobile-Friendly Table Experiences
Responsive Table Display Methods
Large tables often break on smaller screens.
Common responsive approaches include:
| Method | How It Works |
| Horizontal scrolling | Allows users to swipe across columns |
| Column reduction | Removes less important attributes |
| Stacked layout | Converts rows into card-like sections |
Use horizontal scrolling for a 5-column pricing table. Split or restructure a technical table containing 20 attributes.
Preserve Table Meaning Across Devices
Mobile optimization is not only about fitting content on a smaller screen.
The relationships inside the table must remain clear.
Preserve table meaning across mobile devices by following 4 practices:
- Display visible column labels.
- Preserve logical row relationships.
- Use consistent terminology.
- Prioritize decision-critical information.
Avoid creating separate mobile-only versions with different data.
Different content versions can confuse users and create inconsistent signals for search systems.
Common Table-Format Answer Mistakes
Using Tables Without a Clear Information Purpose
A table should solve a comparison or organization problem.
Poor use cases:
- Turning every paragraph into a table
- Adding empty comparison columns
- Repeating the same information from nearby text
A table should reduce complexity, not create another layer.
Creating Overly Complex Tables
More data does not always mean better content.
Common issues:
- Too many columns
- Long paragraphs inside cells
- Multiple concepts mixed together
- Difficult scanning
Simplify a 20-column product table in 3 ways: retain primary decision factors, move secondary specifications into supporting sections, and split unrelated data into separate tables.
Missing Supporting Context
A table without context presents values but does not explain what was measured, when it was measured, or how users should interpret the result.
Example:
| Metric | Value |
| CTR | 5% |
The user still needs:
- What was measured?
- What period?
- Is 5% good or bad?
Poor Formatting and Inconsistent Data
Consistency affects both usability and extraction.
Avoid:
- Different naming conventions
- Mixed units
- Missing values
- Unclear labels
Example:
Poor:
| Plan | Cost |
| Basic | $10 |
| Pro | Ten dollars/month |
Better:
| Plan | Monthly Cost |
| Basic | $10/month |
| Pro | $10/month |
Examples of Effective Table-Format Answers
SEO Comparison Table Example
Query: “Best SEO tools comparison”
| Tool | Best For | Main Capability |
| Ahrefs | Backlink analysis | Link intelligence |
| Semrush | Competitive research | Keyword and competitor data |
| Google Search Console | Website monitoring | Search performance reports |
This format works because:
- Entities are clear
- Attributes match user intent
- Values are concise
Research Data Table Example
Statistical reporting often depends on precise formatting.
Example: ANOVA reporting
| Source | df | F-value | p-value |
| Between Groups | 2 | 5.43 | 0.01 |
| Within Groups | 97 | — | — |
Research tables work because numerical relationships are easier to verify visually.
Knowledge Reference Table Example
Definition queries often benefit from direct-answer formatting.
| Concept | Definition |
| Crawlability | Ability of search engines to access website pages |
| Indexability | Ability of pages to be stored in search indexes |
| Ranking | Position assigned in search results |
These tables can improve extraction for definition-based searches.
Tools for Creating and Evaluating Table-Format Answers
Table Creation and Data Management Tools
Useful tools include:
| Tool | Best Use |
| Google Sheets | Collaborative data preparation |
| Microsoft Excel | Advanced calculations and datasets |
| Notion | Lightweight content databases |
Writers build tables in spreadsheets first, then convert them into website-ready HTML or CMS formats.
SEO and Visibility Analysis Tools
SEO tools help evaluate whether structured content performs.
| Tool | Purpose |
| Google Search Console | Track impressions, clicks, rankings |
| Ahrefs | Analyze rankings and competitors |
| Semrush | Monitor visibility and keyword performance |
Performance data helps identify whether tables are earning search visibility or simply occupying page space.
Measuring Table-Format Answer Performance
Search Visibility Metrics
Track whether tables contribute to organic growth.
Important metrics:
- Featured Snippet appearances
- Organic rankings
- Search impressions
- Click-through rate
- Query visibility
A table ranking for a comparison query may generate traffic even without a traditional first-position result.
User Engagement Metrics
Measure whether users actually interact with the information.
Monitor:
- Time on page
- Scroll depth
- Engagement signals
- Conversion actions
A table that improves decision-making should support business outcomes, not only rankings.
AI Search Performance
AI search visibility requires additional monitoring.
Track:
- AI Overview appearances
- Citations in generated answers
- Brand mentions in AI responses
- Retrieval frequency
Key Takeaways
- Table-format answers organize information into entities, attributes, and values.
- Tables work best for comparisons, references, specifications, and datasets.
- Search engines and AI systems benefit from clear semantic relationships.
- HTML structure, accessibility, and mobile usability affect extraction quality.
- A table should solve an information problem, not replace meaningful explanations.
- The strongest tables combine user intent, structured formatting, accurate data, and machine-readable relationships.
FAQs About Table-Format Answers
What is a table-format answer?
A table-format answer is information organized into rows and columns to present relationships between entities, attributes, and values. It is commonly used for comparisons, specifications, definitions, and datasets.
What is the format of a table?
A table consists of:
- Headers that describe columns
- Rows containing records or examples
- Cells containing individual data points
A typical structure is:
| Header 1 | Header 2 |
| Data | Data |
What is a table answer?
A table answer provides a direct response using structured data instead of only paragraphs. Search engines often use table answers for comparison and reference queries.
How do you write information in table format?
Identify the entities being discussed, select important attributes, create descriptive headers, and place consistent values into rows.
What is table question answering?
Table question answering is an AI task where systems retrieve answers from structured tables rather than unstructured text.
Are tables good for SEO?
Tables support SEO when they answer comparison or reference queries with accurate, crawlable, and clearly labeled data. Formatting alone does not guarantee rankings.
Do tables help with Featured Snippets?
Tables can increase eligibility for table-based Featured Snippets because search engines can extract organized rows and columns more easily.
Can AI systems understand HTML tables?
Yes. Properly structured HTML tables provide clearer relationships between entities and attributes, helping AI systems retrieve information.
When should you use tables instead of lists?
Use tables when users need to compare multiple attributes. Use lists when the order or grouping of items matters more than comparison.
What are examples of statistical tables?
Common examples include ANOVA tables, correlation tables, regression output tables, and t-test result tables.