


Page speed optimization makes web pages load faster, respond quickly, and remain stable. It improves server response, images, JavaScript, CSS, caching, and browser rendering. Slow pages can frustrate visitors and reduce conversions. Poor performance may also affect search visibility because Google uses Core Web Vitals in its ranking systems. Effective page speed optimization starts with accurate testing. You need to identify the slowest parts of a page, find their causes, and apply the right fixes. This guide explains how to measure website speed, improve Core Web Vitals, prioritize fixes, and verify performance gains.
What Is Page Speed Optimization?
Page speed optimization is the process of improving how fast a webpage loads, displays content, and responds to users. It removes delays that make browsing difficult. A page may display its main content quickly but respond slowly to clicks. Another may respond well but take too long to show its main image. Both pages have speed issues, but they need different fixes. Page speed optimization addresses these problems through faster resource delivery, efficient code, and better browser rendering.
Page Speed vs Website Speed vs Page Load Time
These terms describe different parts of web performance.
| Term | Meaning | Main focus |
| Page speed | How quickly one page displays content and responds | Individual page performance |
| Website speed | Performance across pages on a website | Overall site experience |
| Page load time | Time taken to reach a defined loading milestone | Loading duration |
| Core Web Vitals | Metrics for loading, responsiveness, and visual stability | Real-user experience |
A page might finish loading in four seconds but display useful content after two seconds. It may also remain slow when visitors try to interact. This is why modern page speed optimization uses several metrics instead of one loading time.
How a Webpage Loads in the Browser
When someone opens a webpage, the browser performs several tasks.
- Request: The browser requests the page from the server.
- Response: The server sends the HTML document.
- Resource discovery: The browser identifies images, CSS, JavaScript, and fonts.
- Rendering: The browser processes the page structure and styles.
- Display: Visible content appears on the screen.
- Interaction: The browser processes clicks, typing, and other actions.
These tasks can overlap. Some resources may also delay others. For example, a large stylesheet may delay the first visible content. A long JavaScript task may prevent a button from responding.
Why Is Page Speed Important for SEO and User Experience?
Page speed affects how visitors use a website. Faster pages help people find information, browse products, and complete tasks with fewer delays. Speed also supports technical SEO. However, it does not replace relevant content, useful information, or other ranking factors.
How Page Speed and Core Web Vitals Affect SEO
Google uses Core Web Vitals within its ranking systems. These metrics assess loading performance, responsiveness, and visual stability. Good Core Web Vitals support a better page experience. However, passing these metrics does not guarantee higher rankings. Google also considers relevance, content quality, and other signals when ranking pages. Page speed optimization supports SEO by helping users access content without unnecessary delays.
It can also improve the experience of visitors arriving from organic search. A fast page with weak content may still perform poorly. A useful page can also rank despite some speed issues. The goal is to improve performance while preserving content quality.
How Slow Pages Affect User Engagement and Conversions
Slow pages affect engagement and conversions. An online shopper may wait too long for product images. A visitor may struggle to open a menu. A potential customer may leave before a form becomes usable. Consider an e-commerce page that displays product details quickly. When someone selects a product option, the page freezes for one second.
The loading experience seems fast, but the interaction feels slow. Businesses should assess performance alongside conversion rate, form completion, checkout abandonment, and engagement by device. These measures help show the value of faster pages. However, conversion changes may have several causes.
Which Page Speed Metrics Should You Measure?
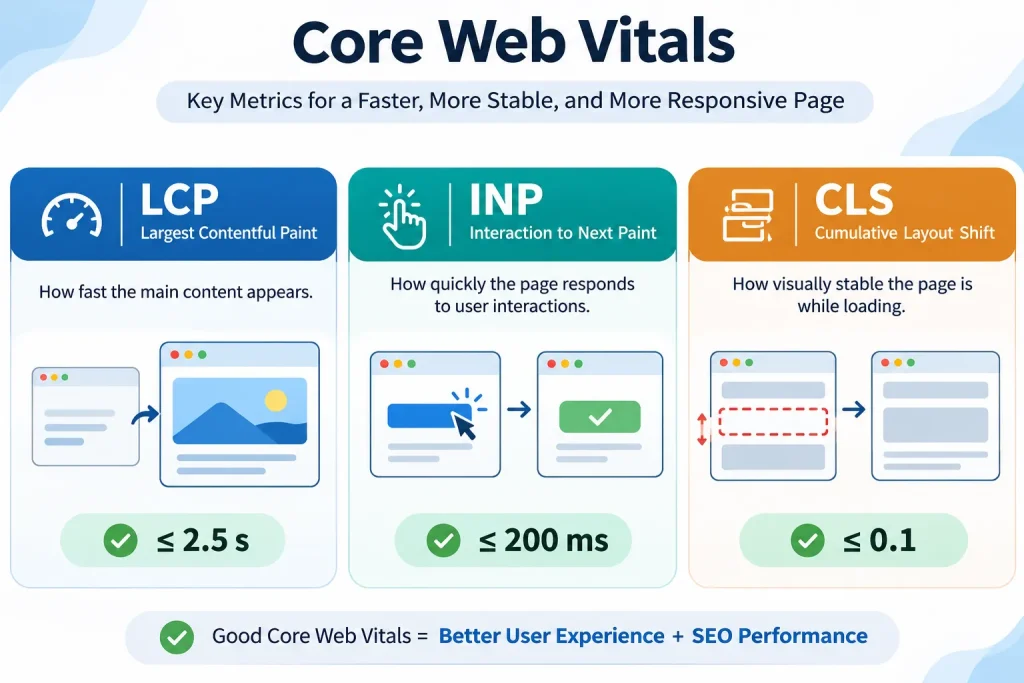
The three main Core Web Vitals are Largest Contentful Paint (LCP), Interaction to Next Paint (INP), and Cumulative Layout Shift (CLS).
They measure loading performance, responsiveness, and visual stability. Google recommends measuring these metrics at the 75th percentile of real-user experiences. Mobile and desktop results should be assessed separately.
| Metric | Good | Needs improvement | Poor |
| LCP | ≤ 2.5 seconds | > 2.5 to 4 seconds | > 4 seconds |
| INP | ≤ 200 ms | > 200 to 500 ms | > 500 ms |
| CLS | ≤ 0.1 | > 0.1 to 0.25 | > 0.25 |
A page or origin passes the Core Web Vitals assessment when all three metrics meet their good thresholds in the applicable field data.
Largest Contentful Paint (LCP): Loading Performance
Largest Contentful Paint measures when the largest qualifying content element becomes visible within the viewport. This element is a hero image, large heading, or main content block. A good LCP is 2.5 seconds or less. For example, a page may show its navigation after one second. However, the main product image might take five seconds to appear. Visitors can see the page structure but must still wait for important content. LCP helps identify this delay.
Interaction to Next Paint (INP): Page Responsiveness
Interaction to Next Paint measures how quickly a page responds visually to user interactions. It considers clicks, taps, and keyboard input across a visit. It reflects the page’s overall responsiveness rather than only the first interaction.
A good INP is 200 milliseconds or less.
For example, a visitor clicks an accordion heading. The content takes 700 milliseconds to appear. The visitor may think the button failed. INP includes input delay, event processing, and the time needed to display the next frame. INP replaced First Input Delay (FID) as a Core Web Vital in March 2024.
Cumulative Layout Shift (CLS): Visual Stability
Cumulative Layout Shift measures unexpected movement of visible page elements. A good CLS score is 0.1 or less. Imagine someone reading an article when an advertisement appears above the text. The paragraph moves downward, forcing the reader to find their place again. A button might also move just before someone clicks it. CLS measures the impact of these unexpected shifts. It is a unitless score, not a time measurement. Some changes caused by recent user input are excluded from the metric.
Supporting Metrics: TTFB, FCP and Speed Index
Core Web Vitals show the main user experience problems. Supporting metrics help explain their causes.
| Metric | What it measures | Main use |
| Time to First Byte (TTFB) | Time until the first response byte arrives | Assess server and network delays |
| First Contentful Paint (FCP) | Time until the first content appears | Assess initial rendering |
| Speed Index | How quickly visible content fills the screen in a lab test | Assess visual loading |
| Total Blocking Time (TBT) | Main-thread blocking during a lab test | Diagnose potential responsiveness issues |
For example, high TTFB may contribute to poor LCP. High TBT may indicate JavaScript work that could harm responsiveness. These metrics support diagnosis but do not replace Core Web Vitals.
How to Test Website Speed and Interpret the Results
Website speed testing combine real-user data with controlled tests. Real-user data shows what visitors experience. Controlled tests help developers locate technical problems. Both are needed for accurate diagnosis.
Test a URL With Google PageSpeed Insights
Google PageSpeed Insights is a free tool that reports page performance and suggests improvements.
To test a page:
- Open PageSpeed Insights.
- Enter the full page URL.
- Select Analyze.
- Review the mobile and desktop results.
- Check the Core Web Vitals assessment when field data is available.
- Review Lighthouse diagnostics for possible causes.
Start with the weakest real-user metric.
For example, if LCP is poor, identify the LCP element. Then inspect the delays affecting that element. Avoid fixing every warning without checking its impact. PageSpeed Insights combines Chrome User Experience Report data with Lighthouse lab testing. These sources provide different types of evidence.
Understand Lab Data vs Real-User Field Data
Lab data comes from controlled tests. Field data comes from actual user visits.
| Factor | Lab data | Field data |
| Source | Simulated test | Real Chrome user experiences |
| Conditions | Controlled settings | Different devices and networks |
| Purpose | Diagnose problems | Measure experience |
| Common source | Lighthouse | Chrome UX Report |
| Main limitation | May miss real interactions | May lack detailed root causes |
A page may receive a high Lighthouse score but fail Core Web Vitals in the field. For example, a lab test may load the page without using its filters. Real visitors may experience delays when they interact with those features. Field data also reflects a wider range of devices and network conditions. Chrome UX Report uses a rolling 28-day period for standard field metrics. Recent fixes may take time to appear. Some URLs lack enough eligible visits for URL-level field data. PageSpeed Insights may then show origin-level data or no field assessment.
Use Chrome DevTools and Search Console for Deeper Analysis
Chrome DevTools helps developers inspect performance problems. Its Performance panel shows JavaScript execution, rendering work, network activity, and long tasks. The Network panel helps identify slow requests, large files, and late resource discovery. Google Search Console provides a broader view. Its Core Web Vitals report groups URLs with similar issues and separates mobile and desktop results. A useful workflow is to:
- Identify affected URL groups in Search Console.
- Test representative pages in PageSpeed Insights.
- Inspect the failing metric in Chrome DevTools.
- Record the cause before making changes.
This approach connects site-wide problems with specific technical evidence.
What Causes Slow Website Loading and Poor Core Web Vitals?
Slow pages have several performance problems at once. A page may have a slow server response, large resources, and expensive JavaScript tasks. The key is to identify which problem affects the failing metric.
Slow Server Response and Network Delays
A browser cannot display server-generated HTML before receiving the response. High TTFB may result from slow application code, database queries, hosting limits, redirects, or network delays. A slow initial response can also delay the discovery of important images and stylesheets. However, high TTFB does not always mean the hosting provider is responsible.
Heavy Images, Fonts and Render-Blocking Resources
Large images require more data to download. Poor compression and oversized dimensions increase loading time. These are also important considerations for image SEO. Web fonts may delay text display or change text dimensions after loading. CSS and synchronous scripts also delay rendering. These problems affect FCP and LCP. Fonts may also contribute to CLS.
Excessive JavaScript and Third-Party Scripts
Large JavaScript files take time to download, parse, and execute. Long tasks block the browser’s main thread and delay user interactions. Third-party tools add more work. Examples include analytics tags, advertising scripts, chat widgets, and embedded services. These issues affect INP, especially on slower devices.
Dynamic Content and Unexpected Layout Changes
Dynamic elements move existing content when they appear without reserved space. Common causes include ads, images, videos, banners, and JavaScript-added content. The problem is unexpected movement that disrupts users.
How to Improve Largest Contentful Paint (LCP)
To improve LCP, reduce the time needed to display the largest visible content element. Start by identifying that element and the delay affecting it. LCP has four main timing components:
- TTFB: Time spent waiting for the initial server response.
- Resource load delay: Time before the browser starts loading the LCP resource.
- Resource load duration: Time spent downloading that resource.
- Element render delay: Time between resource availability and the element appearing.
For text-based LCP elements, resource loading may not be a separate factor. The breakdown depends on the element and page structure. Understanding these components helps teams avoid unnecessary changes.
Improve Server Response With Caching and a CDN
Slow server responses delay the entire loading process. Server-side caching reduces repeated work by storing reusable responses. A Content Delivery Network (CDN) can serve cached resources from locations closer to visitors. This may reduce network delays. Other improvements include removing unnecessary redirects, optimizing database queries, and reducing slow application processing. Start by checking TTFB in the Network panel. If the initial response is slow, inspect server timing and cache behaviour before changing images or CSS. A CDN helps with network delays, but it cannot fix every problem caused by slow application code.
Optimize Images and Prioritize the LCP Resource
Hero images are common LCP elements. Large files, late discovery, and low loading priority can delay their display.
Useful improvements include:
- Serve images at suitable dimensions.
- Use WebP or AVIF when appropriate.
- Compress files without losing important detail.
- Use srcset and sizes for responsive images.
- Avoid lazy loading the LCP image.
- Prioritize the LCP resource when testing shows a need.
For example, an image displayed at 900 pixels wide may not need a 3000-pixel source on that device. If the LCP image is present in the initial HTML, the browser can often discover it early.
When an important image is discovered late, preloading may help. The fetchpriority=”high” attribute can also indicate its importance. Use these methods selectively. Giving too many resources high priority reduces their benefit.
Reduce Render-Blocking CSS and Resource Delays
Render-blocking resources can delay visible content even when images download quickly. Large stylesheets may need to be processed before the browser can display the page. Developers reduce these delays by removing unused CSS, making critical styles available early, and loading noncritical resources without blocking initial rendering. JavaScript that is not required for initial rendering can often use defer or another suitable loading method. Test these changes carefully. Delaying essential resources breaks layouts or page functions.
Practical LCP diagnosis example
Consider a hypothetical landing page with an LCP of 4.2 seconds. A performance trace shows:
| LCP component | Duration |
| TTFB | 0.7 seconds |
| Resource load delay | 1.6 seconds |
| Resource load duration | 1.2 seconds |
| Element render delay | 0.7 seconds |
| Total LCP | 4.2 seconds |
The largest delay occurs before the LCP resource starts downloading. The developer discovers that JavaScript inserts the hero image after the initial HTML loads. The team makes three changes:
- Places the image reference in the initial HTML.
- Removes lazy loading from the hero image.
- Gives the image appropriate loading priority.
The next controlled tests show an LCP of 2.3 seconds. This is an illustrative example, not a measured case study. The improvement must still be checked against real-user data. The important lesson is that reducing image file size alone would not address the largest delay.
How to Improve Interaction to Next Paint (INP)
Improving INP means reducing the delay between a user action and the browser’s next visual response. INP problems involve JavaScript execution, event handling, or expensive rendering. A page may load quickly but become slow when visitors use its features.
Identify and Break Up Long JavaScript Tasks
Long tasks prevent the browser from processing user input. For example, a product filter may perform a large calculation before showing updated results. During that task, the browser may not respond to other actions. Use Chrome DevTools to record the slow interaction. Look for long tasks and expensive functions near the event. For sites that rely heavily on scripts, JavaScript SEO and rendering also deserve attention.
Developers can improve responsiveness by splitting large tasks into smaller units. Suitable calculations also move to Web Workers. This allows them to run without blocking the main thread. However, Web Workers cannot directly update the DOM. The main thread still handles those changes. The goal is to keep important user interactions responsive.
Reduce Unnecessary Scripts and Third-Party Work
Third-party scripts compete with essential page functions. A website may load several analytics tools, chat widgets, advertising services, and tracking scripts. Some continue processing after the page becomes visible. Audit these scripts to identify unnecessary work. Remove duplicate tags and unused tools. Delay nonessential scripts when it is safe to do so. A tag manager organizes scripts, but it does not automatically reduce their processing cost. Measure each change to confirm that it improves responsiveness.
Reduce Rendering Work After User Interactions
A slow interaction does not always come from JavaScript execution alone. After an event handler runs, the browser may need to recalculate styles, update layouts, and paint the next frame. Large DOM structures and repeated layout calculations can make this work expensive. Developers reduce rendering costs by updating only the necessary elements and avoiding repeated layout calculations. For example, a product filter should update relevant results without rebuilding unrelated page sections.
Practical INP diagnosis example
Suppose a product filter has an INP of 620 milliseconds. A performance trace shows:
| Interaction stage | Duration |
| Input delay | 90 ms |
| Event processing | 410 ms |
| Presentation delay | 120 ms |
| Total | 620 ms |
The delay occurs during event processing. The developer finds that the filter runs a large calculation on the main thread. After optimizing the calculation and reducing unnecessary DOM updates, a repeat test records 170 milliseconds. These are hypothetical figures. They illustrate why developers should inspect the interaction stages before choosing a fix.
How to Reduce Cumulative Layout Shift (CLS)
To reduce CLS, prevent visible elements from moving unexpectedly as a page loads or changes. The main goal is to give elements predictable space and avoid disruptive content changes.
Reserve Space for Images, Videos and Embedded Content
Browsers need to know how much space an element will occupy. When an image has no defined dimensions, the browser display nearby text first. The text then moves when the image loads. Set suitable width and height attributes or use CSS aspect-ratio.
For example:
<img
src=”product-image.webp”
width=”800″
height=”600″
alt=”Product image”
>
The browser use these dimensions to reserve space before the image loads. Responsive CSS can resize the image while preserving its proportions. Apply the same principle to videos, maps, and embedded content.
Prevent Layout Shifts From Fonts, Ads and Dynamic Elements
Web fonts change text dimensions after loading. Use suitable fallback fonts and consider font metric adjustments to reduce unexpected movement. Advertisements also cause layout shifts when their sizes vary. Reserve space for ad placements where practical. Avoid inserting new elements above content that users are already viewing. Cookie notices and promotional banners should use predictable layouts. For example, an overlay may avoid pushing content downward. However, it must not block essential controls or harm accessibility. CLS fixes should improve stability without creating new usability problems.
Which Additional Website Speed Techniques Are Worth Using?
Core Web Vitals fixes address specific user experience issues. Other techniques improve resource delivery and repeat visits. These methods are useful when testing shows a clear need.
Enable Compression and Efficient Resource Delivery
Compression reduces the data transferred between the server and browser.
- Brotli and Gzip are common methods for compressing HTML, CSS, and JavaScript.
- Modern protocols such as HTTP/2 and HTTP/3 can also improve resource delivery under suitable conditions.
- Other useful techniques include removing unused code, reducing unnecessary requests, and splitting large JavaScript bundles.
- Code splitting allows a website to load some features only when visitors need them.
For example, an advanced reporting tool may not need to load before someone opens the reporting section. However, splitting code into too many files can create extra requests and delays. Measure the results before making further changes.
Improve Repeat Visits With Browser Caching and Back/Forward Cache
Browser caching stores eligible resources locally. This reduces repeated downloads when visitors return to a page. Static files such as images, fonts, and versioned scripts can often use longer cache periods. Cache rules must also account for updates. Otherwise, visitors may receive outdated files. The back/forward cache, or bfcache, serves a different purpose. It allows eligible pages to be restored from memory when visitors navigate backward or forward. This makes navigation feel almost immediate. Developers can inspect bfcache eligibility in Chrome DevTools and address blockers where practical. Browser caching and bfcache support faster browsing, but they work in different ways.
How Should You Prioritize Page Speed Fixes?
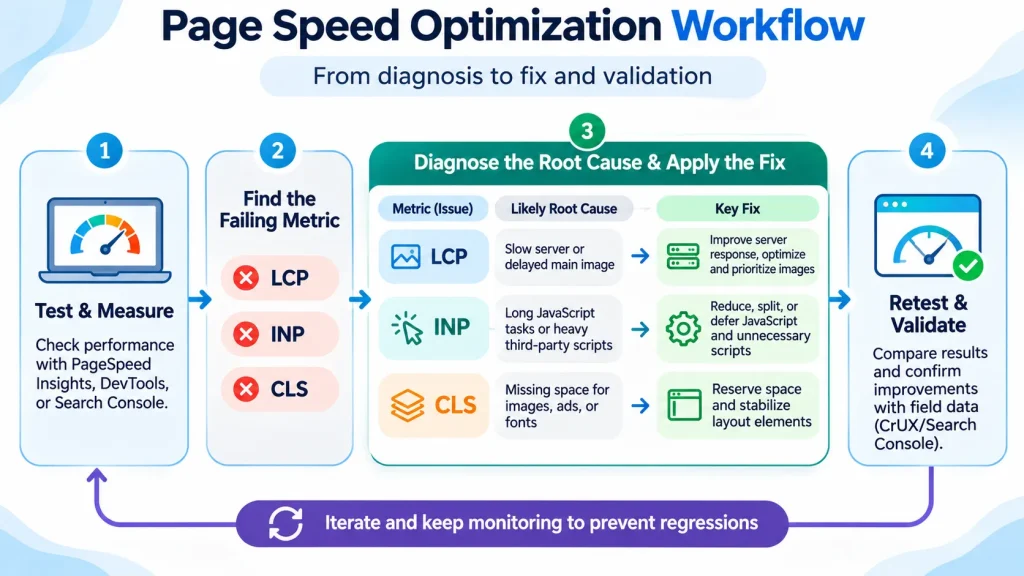
Prioritize page speed fixes based on the failing metric, verified root cause, expected impact, effort, and risk. A website may have dozens of performance warnings. Fixing every warning without a plan can waste time and create new problems. Start with the issues that affect important pages and real users.
Match Each Performance Issue to Its Root Cause
The following matrix connects common performance findings with likely causes and suitable fixes.
| Performance finding | Likely root cause | Recommended fix | Main metric |
| Main image appears late | Late discovery or large image | Improve discovery and image delivery | LCP |
| Initial HTML arrives slowly | Server or network delay | Review TTFB, caching, and server work | TTFB, LCP |
| Button responds slowly | Long JavaScript task | Reduce or split main-thread work | INP |
| Product filter freezes | Expensive calculations or DOM updates | Optimize event processing and rendering | INP |
| Text moves after an image loads | Missing image dimensions | Reserve image space | CLS |
| Text shifts after font loading | Font metric differences | Improve fallback font matching | CLS |
| Repeat visits download large files | Weak caching rules | Configure browser caching | Repeat-load performance |
This matrix helps narrow the investigation. It does not replace performance testing. For example, a hero image may already be compressed. If the browser discovers it late, further compression may provide little benefit. The fix should address the measured delay.
Rank Fixes by Impact, Effort and Implementation Risk
Use three factors to prioritize work:
- Impact: How much the fix may improve performance and user experience.
- Effort: Time and resources required.
- Risk: Chance of affecting design, features, or business functions.
The following example shows a practical ranking.
| Proposed fix | Expected impact | Effort | Risk | Priority |
| Add missing image dimensions | High for affected CLS issues | Low | Low | High |
| Improve delayed LCP image discovery | High when discovery is the cause | Low–medium | Low | High |
| Remove an unused third-party script | Medium–high if it causes delays | Low–medium | Medium | High after review |
| Rewrite a large JavaScript application | Potentially high | High | High | Requires planning |
| Reduce a small icon file | Low | Low | Low | Low |
These ratings are illustrative. Actual priorities depend on the website. A fix affecting thousands of visits may deserve more attention than a similar issue on a rarely viewed page. Shared components also matter.
For example, improving a navigation script used across 200 pages may provide more value than fixing one minor image issue. For large websites, enterprise SEO services can help coordinate performance improvements across shared templates and high-priority pages. A useful priority system considers both technical impact and the number of users affected.
How to Verify Page Speed Improvements After Implementation
Verify page speed improvements through repeated lab testing and real-user monitoring. A successful code change does not always produce a meaningful performance gain. Testing should confirm that the original problem is resolved and that the change has not created new issues.
Compare Before-and-After Performance Under Consistent Conditions
Record baseline performance before making changes. Include the tested URL, device type, test conditions, key metrics, and known problems. After implementation, repeat the tests under similar conditions. Consider this hypothetical comparison:
| Metric | Before | After | Result |
| LCP | 4.2 seconds | 2.3 seconds | Meets good threshold |
| INP | 280 ms | 180 ms | Meets good threshold |
| CLS | 0.18 | 0.06 | Meets good threshold |
These figures are illustrative, not results from an actual website. For reliable comparisons, use several test runs rather than relying on one result. Check the page’s design and functions as well. A faster page is not a successful improvement if important features stop working.
Monitor Real-User Results and Prevent Regressions
Real-user monitoring shows whether performance changes benefit actual visitors. Use Chrome UX Report, Search Console, or a suitable Real User Monitoring (RUM) system. Track important pages, device types, and changes after new releases. Standard CrUX field data uses a rolling 28-day window; improvements appear gradually. A custom RUM system can provide more detail about individual routes, devices, and interactions.
Teams can also use automated performance tests during development. Performance budgets help identify changes that may slow a website. For example, a team might set a maximum JavaScript transfer size for a key landing page. A new release that exceeds the budget can trigger a review. This helps prevent performance problems from returning.
Frequently Asked Questions About Page Speed Optimization
What Is a Good Google PageSpeed Insights Score?
A Lighthouse performance score of 90–100 is good. Scores from 50–89 need improvement, while scores below 50 are poor. However, the Lighthouse score is based on a controlled lab test. It does not replace real-user Core Web Vitals data. Focus on user experience and the technical issues behind the results rather than chasing a perfect score.
Why Is My Mobile Page Speed Lower Than Desktop?
Mobile devices may have less processing power and slower network connections. Large JavaScript files, heavy images, and complex layouts can make these limits more noticeable. PageSpeed Insights also uses different simulated conditions for mobile and desktop lab tests. Review mobile-specific findings to identify the resources and tasks causing delays.
Does Improving Page Speed Guarantee Higher Google Rankings?
No. Google uses Core Web Vitals within its ranking systems, but page speed is only one part of search performance. Content relevance, quality, and other signals also matter. Improving speed can support SEO and user experience, but ranking gains are not guaranteed.
How Often Should You Audit Website Page Speed?
Review important pages regularly and run deeper audits after major website changes. A monthly review may suit many websites. High-traffic sites may need more frequent monitoring. Test after redesigns, theme updates, plugin changes, and new third-party script installations.
Conclusion: Build a Faster Website With Measurable Improvements
Page speed optimization requires more than reducing file sizes or improving a Lighthouse score. It involves understanding how pages load, respond, and remain stable. Start with Core Web Vitals. Identify the weakest metric, locate its root cause, and select a suitable fix.
Prioritize changes based on expected impact, effort, and risk. Then verify improvements through controlled tests and real-user data. The goal is not a perfect performance score. It is a website that loads important content quickly, responds smoothly, and provides a reliable browsing experience.